Satellite answers for your fields, forests and towns
Ask in plain language. Sentinel Assistant picks the right satellite images, runs the analysis and puts the result on your map. You don't need GIS software or a remote-sensing team.
Map analysis currently covers Czechia, Slovakia and the border regions, 47.7–51.2° N, 11.8–22.6° E
Map workstation
48.37° N 17.71° E
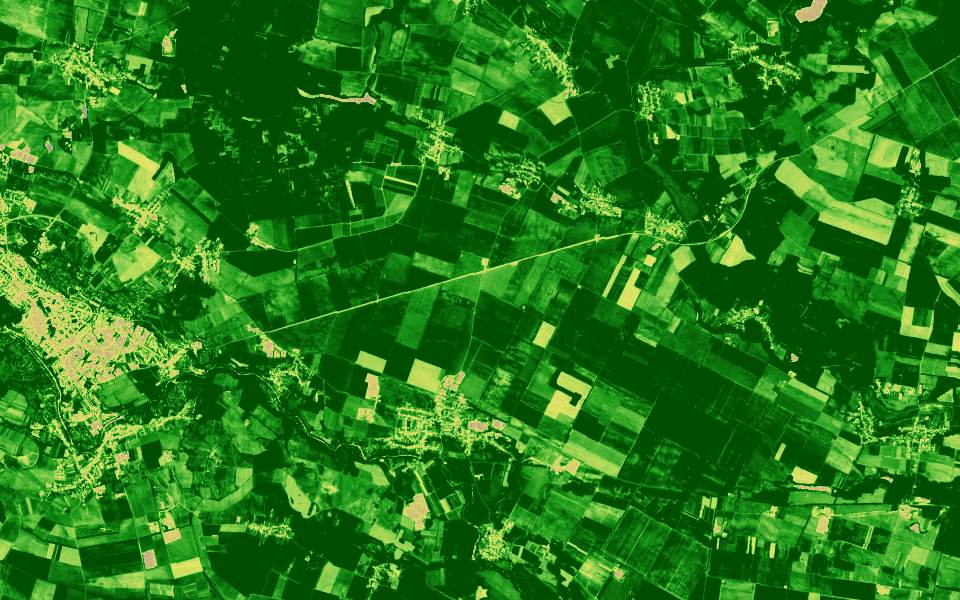
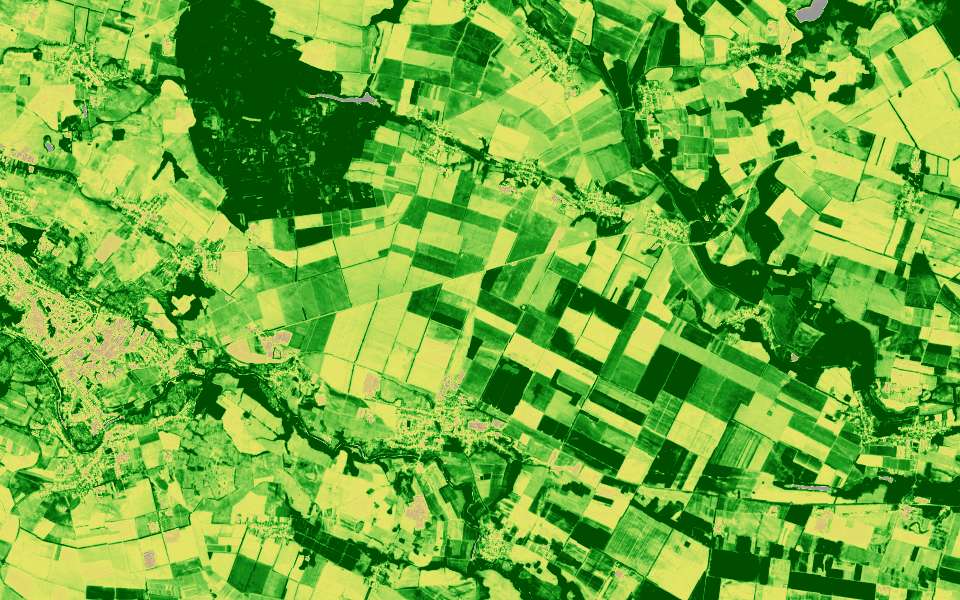
Vegetation (NDVI)
no vegetationvery dense
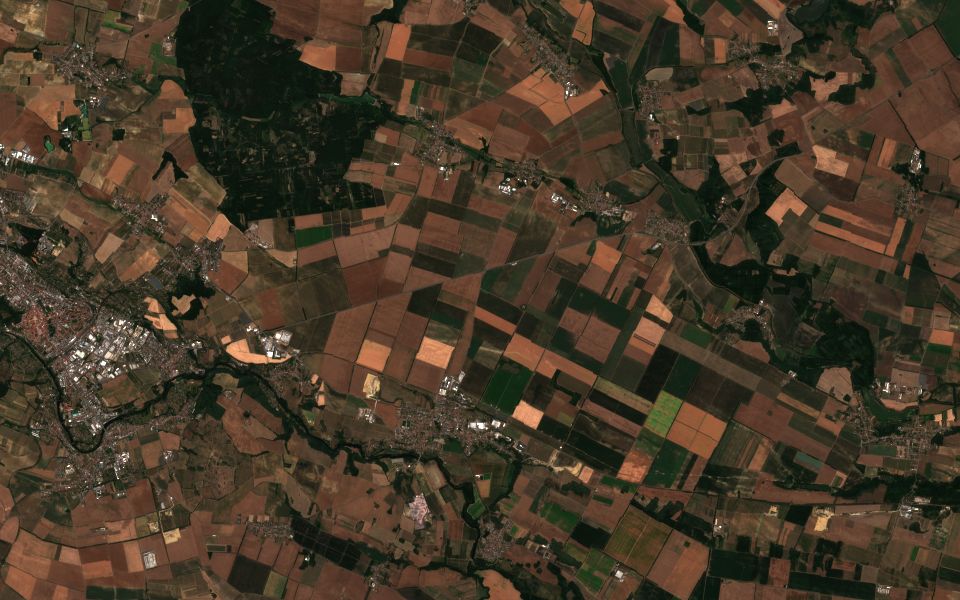
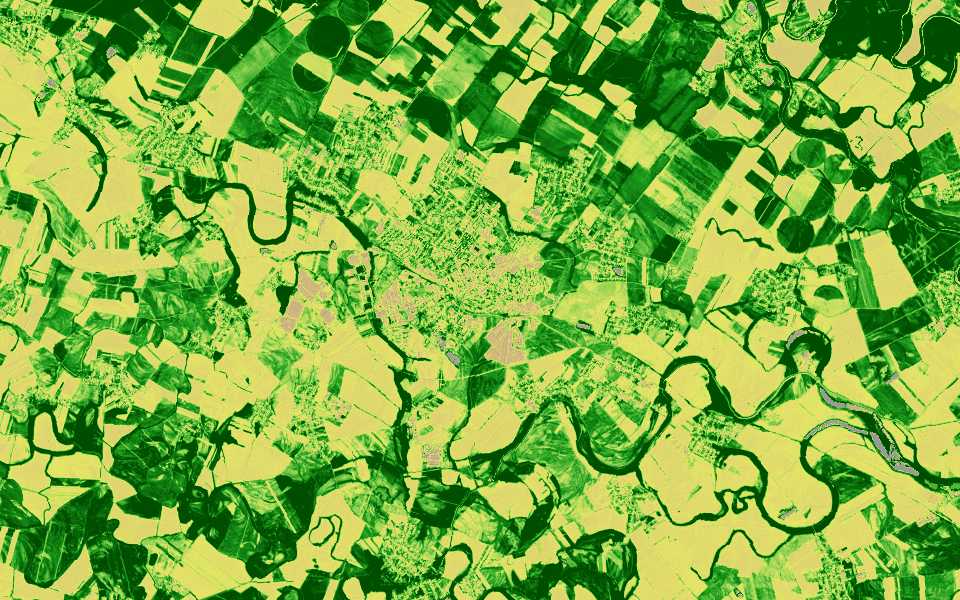
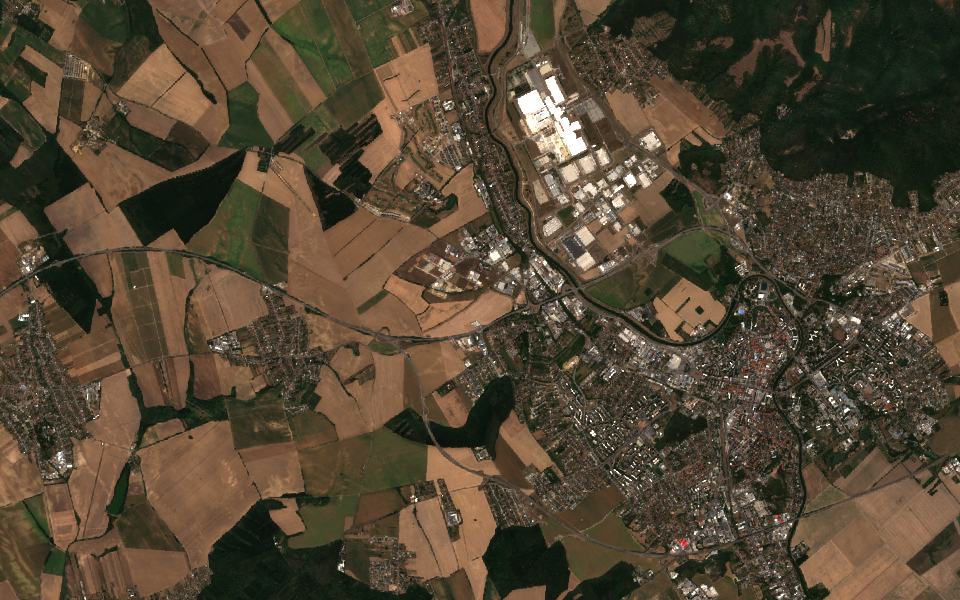
Compare vegetation on the fields east of Trnava, June against September.
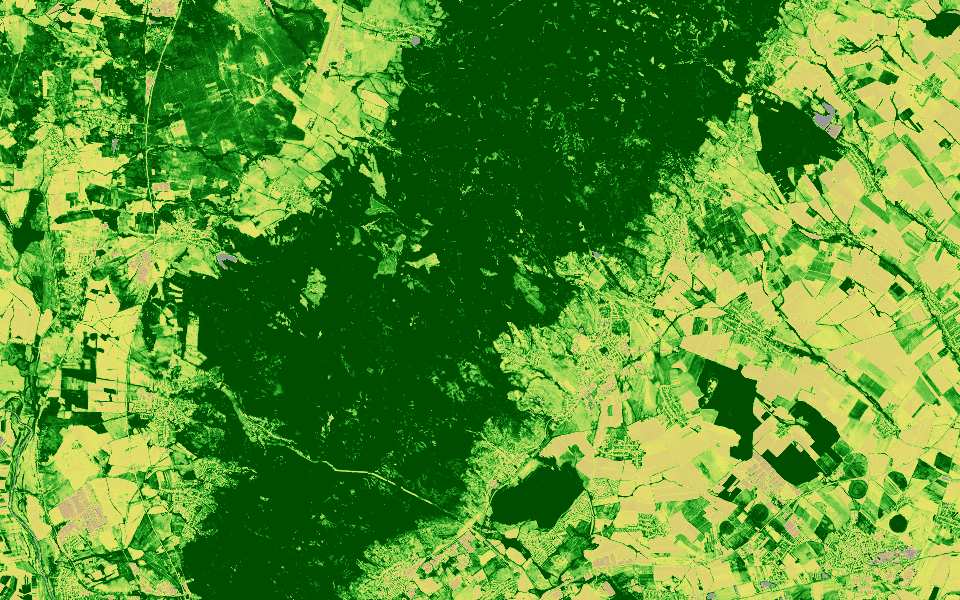
I added a vegetation layer from a Sentinel-2 image taken on 14 September with 3% cloud cover. Most parcels dropped from dense to sparse after the harvest. The forest strip in the north-east hasn't changed.
Layer added: Vegetation (NDVI)Chart: June vs. September
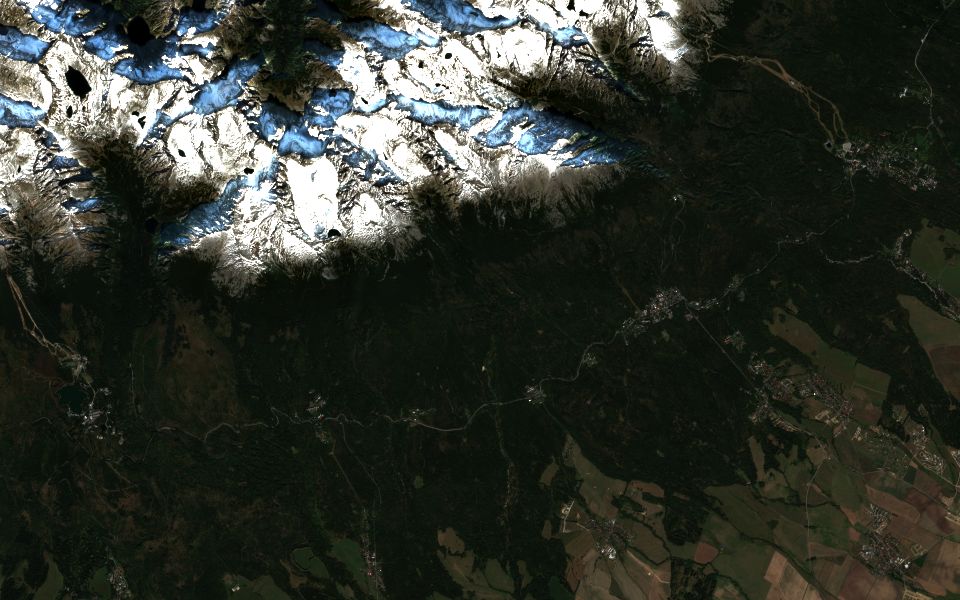
Illustration. The map is a simulated landscape, not real imagery.
91 PB
of Copernicus data online, end of 2025
Since 2015
Sentinel-2 imagery, Sentinel-1 radar since 2014
Every 2–5 days
a new Sentinel-2 image of the same place, cloud permitting
Since 1940
hourly ERA5 climate records
Archive figures are global. Sources: Copernicus Data Space Ecosystem annual report 2025, ESA, ECMWF.
From a question to a map in one conversation
The assistant does the work a remote-sensing analyst would do, step by step, and shows you each result.
Ask
Type a question, draw an area on the map or click a place. Your current map view is sent with every question.
Plan
The assistant chooses the satellite, the dates and an acceptable cloud cover. If something is missing, it asks you before going further.
Analyse
It searches the image catalogues, computes indices and pulls weather and climate records for the same place and time.
See it on the map
Results arrive as map layers, charts and cards. Export a PDF report to share with your team or client.
See a question become a map, a card and a report
Pick an example and step through it: the question, the assistant's plan, the data it fetches, the result on the map and the PDF you can share.
Flood in Krnov, September 2024
Step 1 of 5: AskStep 2 of 5: PlanStep 3 of 5: AnalyseStep 4 of 5: See it on the mapStep 5 of 5: Report
ExampleSentinel Assistant
Assistant
Show where the Opava flooded around Krnov in mid-September 2024, how much rain fell and how many people live in the area.
Looking at the data…
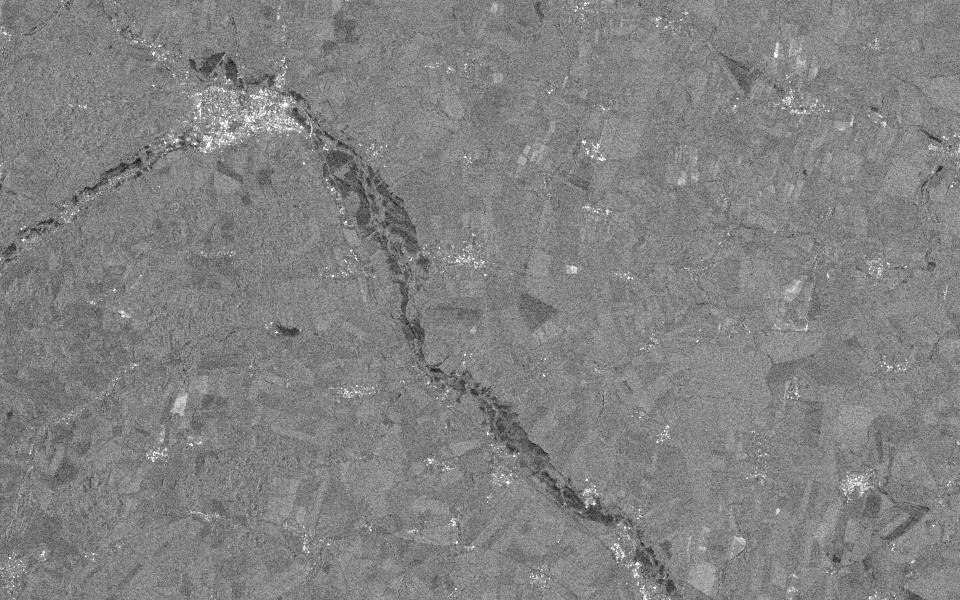
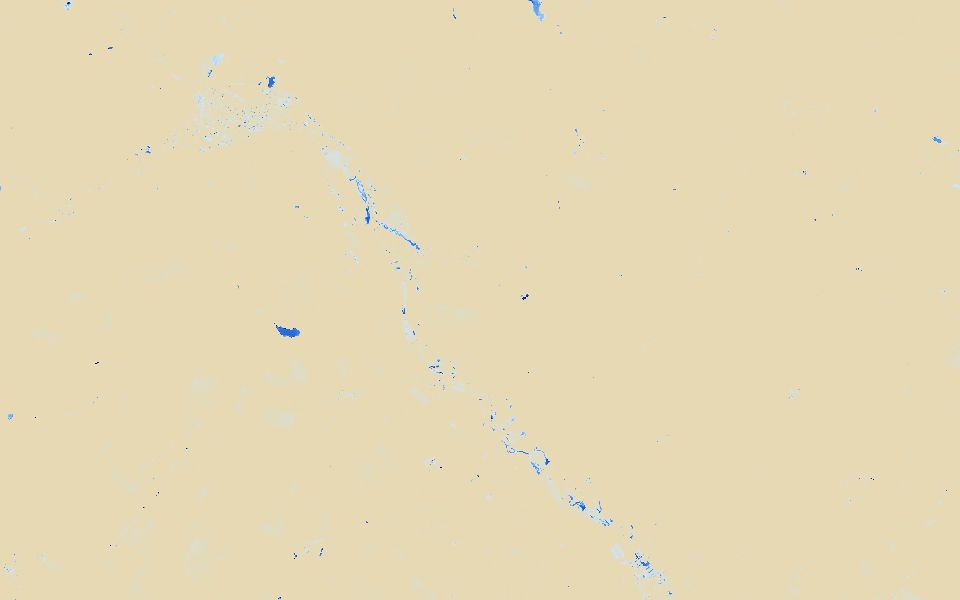
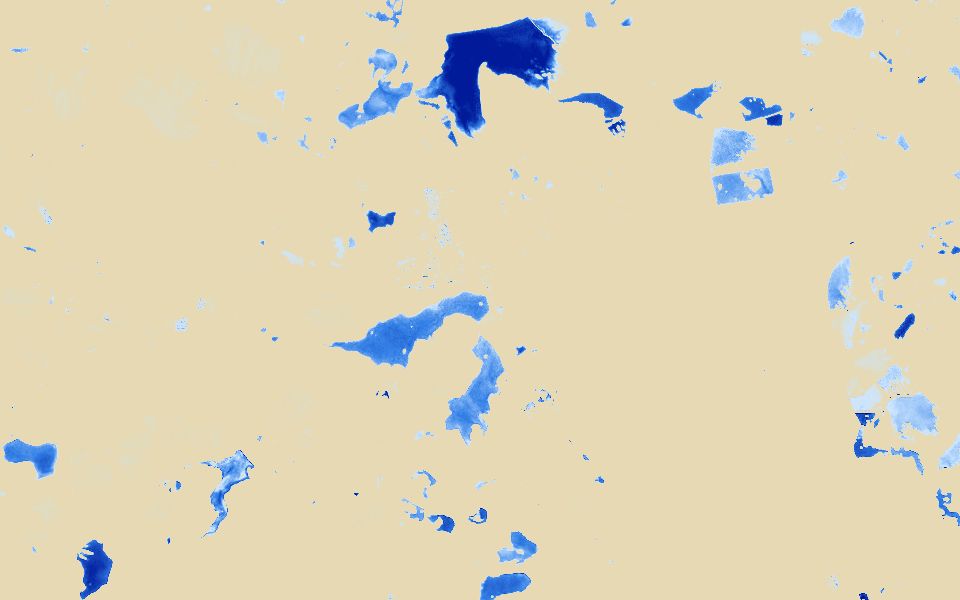
I added radar layers for 3 and 15 September 2024, a true-colour and a water layer for 18 September, and the card “Krnov: flood, September 2024”. On the 15 September radar, dark areas along the Opava mark strong change, covering about 3 % of the analysed area. Most of the rain fell between 12 and 15 September.
Please make a PDF report from this.
Flood in Krnov, September 2024
The report will have these parts:
Flood extent from radar
The area after the flood
Rainfall, residents and elevation
Shall I create it?
Yes, create it.
The report is ready. Download it with the button below.
Download PDFDownload PDF
Ask what you want to see on the map…Show where the Opava flooded around Krnov in mid-September 2024, how much rain fell and how many people live in the area.Show where the Opava flooded around Krnov in mid-September 2024, how much rain fell and how many people live in the area.
Layers
No layers yet.
This image could not be loaded.
Krnov: flood, September 2024
Radar change between 3 and 15 September, rainfall and residents for the analysed area.
Radar change before and after; ERA5 rainfall; residents and elevation for the area
Outputs
Radar, true-colour and water layers; one card with a rainfall chart
Tools the assistant calls: done
Find Krnov on the mapmap_geocode
Check which radar and optical images existsentinel_catalog
Add radar, true-colour and water layersmap_add_satellite_layer ×4
Compare radar before and after the floodsentinel1_analytics
Get ERA5 rainfall for 10–17 Septembercds_era5_timeseries
Check the projected change in precipitationcds_projections_change_signal
Count residents in the areaghs_pop
Sample the elevationopentopo
Put the numbers on a cardmap_add_card
Zoom the map to Krnovmap_fly_to
Report: Flood in Krnov, September 2024
Flood extent from radar
The area after the flood
Rainfall, residents and elevation
About 3 % of the analysed area changed strongly between 3 and 15 September, mostly along the Opava. Rainfall peaked on 14 September.
Fire scar near Hřensko, 2022 to 2026
Step 1 of 5: AskStep 2 of 5: PlanStep 3 of 5: AnalyseStep 4 of 5: See it on the mapStep 5 of 5: Report
ExampleSentinel Assistant
Assistant
Show the burn scar near Hřensko from the 2022 fire and how the forest looks there now.
Looking at the data…
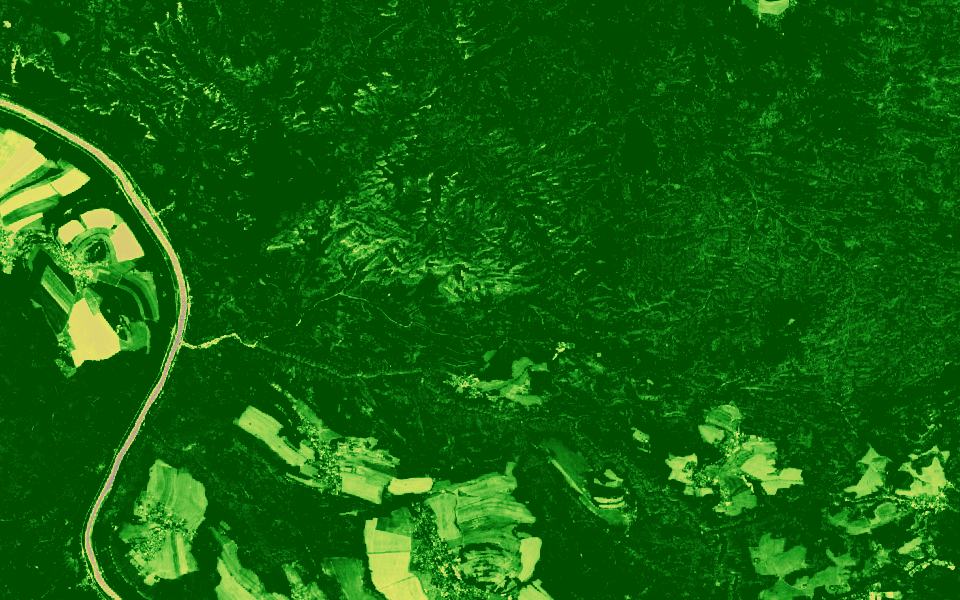
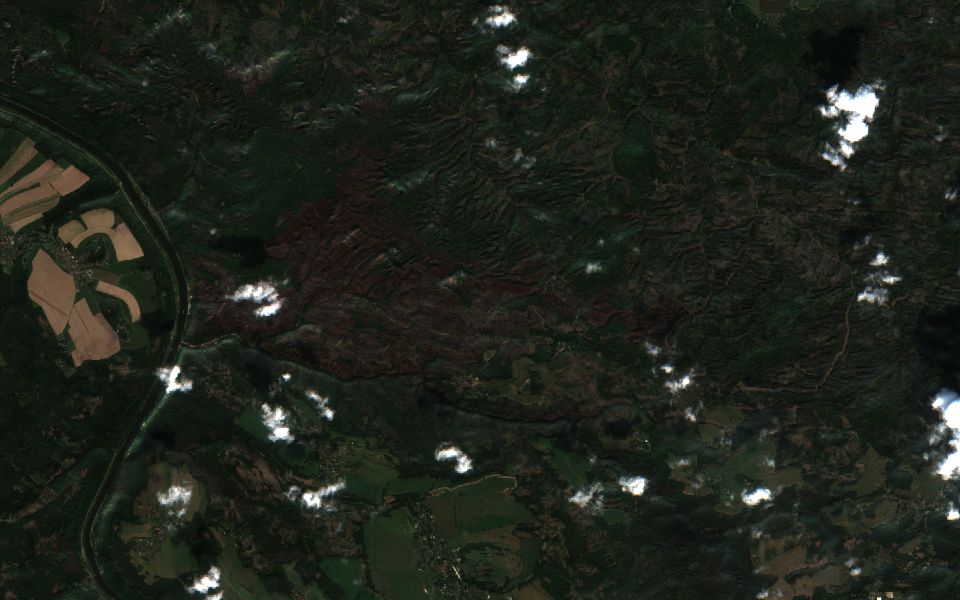
I added burn-index layers for 22 June and 5 September 2022, a true-colour image from 5 September 2022, a vegetation layer for 15 August 2026 and the card “Hřensko: burn scar and regrowth”. On the September 2022 layer, the scar east of the Elbe shows orange to dark red. This August the same area is green again, slightly less dense than the forest around it.
Please make a PDF report from this.
Burn scar near Hřensko, 2022–2026
The report will have these parts:
The burn scar after the fire
Regrowth in 2026
Burn index and summer temperature
Shall I create it?
Yes, create it.
The report is ready. Download it with the button below.
Download PDFDownload PDF
Ask what you want to see on the map…Show the burn scar near Hřensko from the 2022 fire and how the forest looks there now.Show the burn scar near Hřensko from the 2022 fire and how the forest looks there now.
Layers
No layers yet.
This image could not be loaded.
Hřensko: burn scar and regrowth
Burn index before and after the July 2022 fire and vegetation in August 2026, for the analysed area.
The scar is clearly visible in September 2022. By August 2026 vegetation covers most of it again, though less densely than the surrounding forest.
Illustration. The images are real Copernicus Sentinel scenes of each place. The numbers, charts and answers are examples, not measured results.
The July 2022 fire burned more than 1,000 hectares on the Czech side.
Contains modified Copernicus Sentinel data 2022–2026
Behind the scenesThe app doesn't show this. While it runs, you see “Looking at the data…”.
The assistant's plan MAIN AGENT PROMPT
Goal
Map the 2022 burn scar in Bohemian Switzerland and show the regrowth since.
Area
Hřensko and Bohemian Switzerland National Park, 14.20–14.40° E, 50.84–50.92° N
Time range
June 2022 (before), September 2022 (after), August 2026 (now)
Data
Sentinel-2, ERA5 temperature
Processing
Burn index (NBR) before and after; vegetation (NDVI) now; summer 2022 temperature against 1991–2020
Outputs
Burn-index, true-colour and vegetation layers; one card with a chart
Tools the assistant calls: done
Find Hřensko on the mapmap_geocode
Find cloud-free Sentinel-2 imagessentinel_catalog
Add burn-index, true-colour and vegetation layersmap_add_satellite_layer ×4
Compare the burn index before and after the firegeo_insights
Measure vegetation this Augustgeo_insights
Compare summer 2022 temperature with 1991–2020cds_era5_compare_periods
Put the numbers on a cardmap_add_card
Zoom the map to the burn scarmap_fly_to
Report: Burn scar near Hřensko, 2022–2026
The burn scar after the fire
Regrowth in 2026
Burn index and summer temperature
The scar is clearly visible in September 2022. By August 2026 vegetation covers most of it again, though less densely than the surrounding forest.
Greenery around Letná and Stromovka, Prague, August 2026
Step 1 of 5: AskStep 2 of 5: PlanStep 3 of 5: AnalyseStep 4 of 5: See it on the mapStep 5 of 5: Report
ExampleSentinel Assistant
Assistant
Where is greenery weakest around Stromovka and Letná this August, and where does the surface get hottest?
Looking at the data…
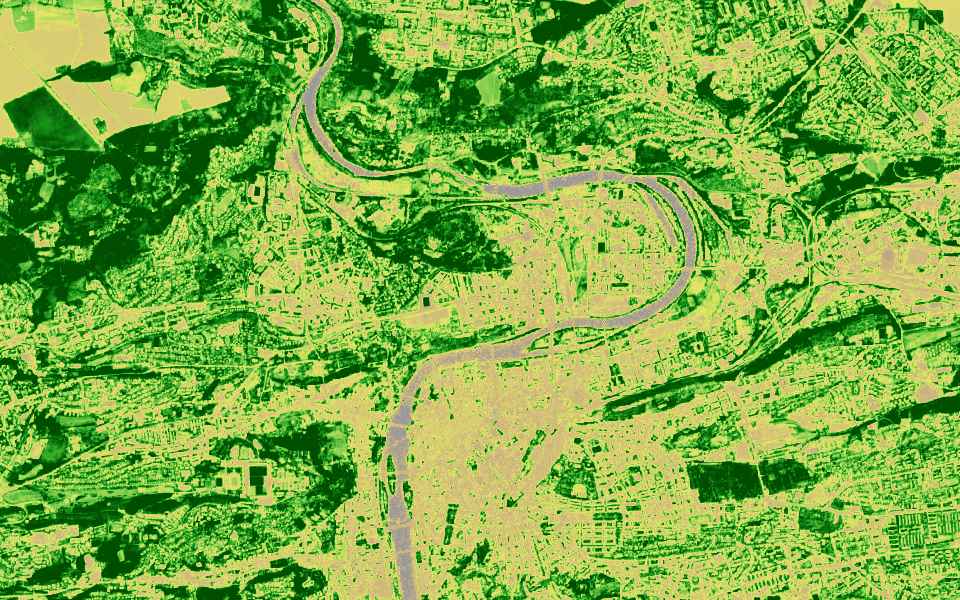
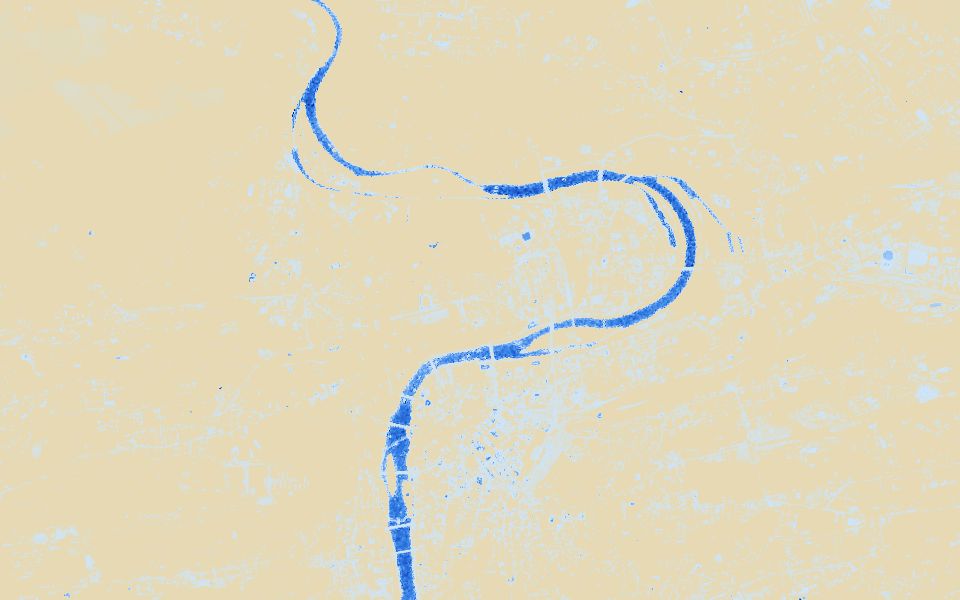
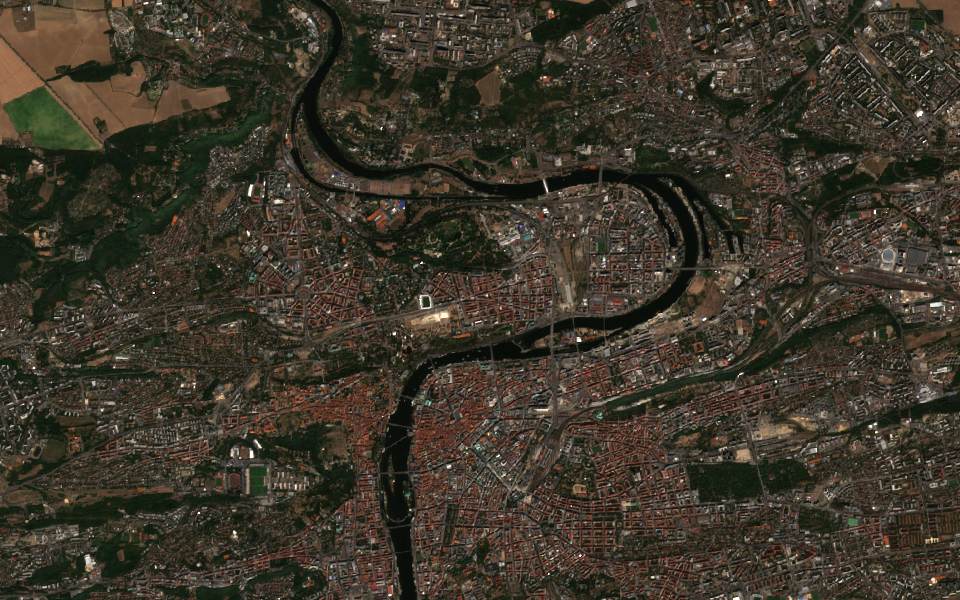
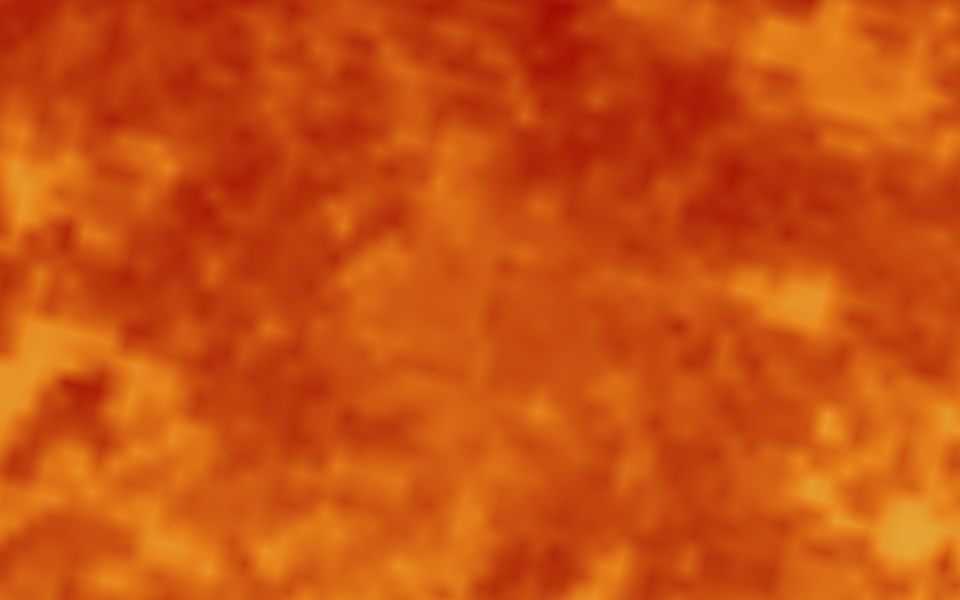
I added vegetation, water and surface-temperature layers for mid-August 2026, a true-colour image and the card “Letná and Stromovka: greenery, August 2026”. Stromovka and the slopes above the river stay dense green, while the Letná plain and Holešovice are sparse or bare. The temperature layer is coarse (1 km) and is warmest over the built-up blocks.
Please make a PDF report from this.
Greenery around Letná and Stromovka, August 2026
The report will have these parts:
Vegetation in August
Water and wet surfaces
Surface temperature and rainfall
Shall I create it?
Yes, create it.
The report is ready. Download it with the button below.
Download PDFDownload PDF
Ask what you want to see on the map…Where is greenery weakest around Stromovka and Letná this August, and where does the surface get hottest?Where is greenery weakest around Stromovka and Letná this August, and where does the surface get hottest?
Layers
No layers yet.
This image could not be loaded.
Letná and Stromovka: greenery, August 2026
Vegetation classes from Sentinel-2 on 14 August, surface temperature from Sentinel-3 on 13 August.
Mean NDVI
0.34
Dense vegetation (NDVI over 0.5)
27 %
Little or no vegetation (NDVI under 0.2)
38 %
Mean daytime surface temperature (1 km)
36 °C
Summer rainfall against 1991–2020
−28 %
Chart data: Share of the area by vegetation (NDVI)
Share of the area by vegetation (NDVI)
under 0.2
38 %
0.2–0.3
14 %
0.3–0.5
21 %
over 0.5
27 %
Greenery around Letná and Stromovka, August 2026
Generated: 19 Oct 2026
1. Vegetation in August
Vegetation (NDVI), 14 Aug 2026 — no vegetation · moderate · very dense
Letná and Stromovka: greenery, August 2026
Mean NDVI: 0.34
Dense vegetation (NDVI over 0.5): 27 %
Little or no vegetation (NDVI under 0.2): 38 %
2. Water and wet surfaces
3. Surface temperature and rainfall
Conclusion
About a quarter of the area has dense vegetation, mostly Stromovka and the slopes above the Vltava. The weakest greenery is on the Letná plain and in Holešovice, which are also the warmest surfaces.
Illustration. The images are real Copernicus Sentinel scenes of each place. The numbers, charts and answers are examples, not measured results.
Contains modified Copernicus Sentinel data 2026
Behind the scenesThe app doesn't show this. While it runs, you see “Looking at the data…”.
The assistant's plan MAIN AGENT PROMPT
Goal
Show where vegetation is weak and where surfaces are hottest around Letná and Stromovka.
Area
Prague: Stromovka, Letná, Holešovice and the Vltava bend
Vegetation (NDVI) in classes; water (NDWI); land-surface temperature; summer rainfall against 1991–2020
Outputs
Vegetation, water, surface-temperature and true-colour layers; one card with a chart
Tools the assistant calls: done
Find Stromovka and Letná on the mapmap_geocode
Find a cloud-free Sentinel-2 imagesentinel_catalog
Add vegetation, water, temperature and true-colour layersmap_add_satellite_layer ×4
Measure vegetation by classgeo_insights
Get the surface temperature (1 km)sentinel3_analytics
Compare summer rainfall with 1991–2020cds_era5_compare_periods
Put the numbers on a cardmap_add_card
Zoom the map to Letnámap_fly_to
Report: Greenery around Letná and Stromovka, August 2026
Vegetation in August
Water and wet surfaces
Surface temperature and rainfall
About a quarter of the area has dense vegetation, mostly Stromovka and the slopes above the Vltava. The weakest greenery is on the Letná plain and in Holešovice, which are also the warmest surfaces.
Farmland east of Znojmo, June 2026 against June 2022
Step 1 of 5: AskStep 2 of 5: PlanStep 3 of 5: AnalyseStep 4 of 5: See it on the mapStep 5 of 5: Report
ExampleSentinel Assistant
Assistant
How does vegetation on the fields east of Znojmo in late June 2026 compare with June 2022, and was this spring drier?
Looking at the data…
I added vegetation layers for 19 June 2022 and 28 June 2026, a true-colour image and the card “Fields east of Znojmo: 2026 against 2022”. Many fields are much less green in late June 2026, and April to June was drier than in 2022. Part of the difference is timing: cereals ripen in late June, so check the true-colour image before putting it down to drought.
Please make a PDF report from this.
Farmland east of Znojmo: 2026 against 2022
The report will have these parts:
Vegetation in June 2022 and 2026
Rainfall and drought index
Topsoil
Shall I create it?
Yes, create it.
The report is ready. Download it with the button below.
Download PDFDownload PDF
Ask what you want to see on the map…How does vegetation on the fields east of Znojmo in late June 2026 compare with June 2022, and was this spring drier?How does vegetation on the fields east of Znojmo in late June 2026 compare with June 2022, and was this spring drier?
Layers
No layers yet.
This image could not be loaded.
Fields east of Znojmo: 2026 against 2022
Vegetation in late June and spring rainfall, 2026 compared with 2022.
Mean NDVI, 19 June 2022
0.71
Mean NDVI, 28 June 2026
0.52
Rainfall April–June 2022 (ERA5)
141 mm
Rainfall April–June 2026 (ERA5)
118 mm
Drought index (SPI), latest available
−0.8
Clay in the topsoil (0–5 cm)
24 %
Chart data: Rainfall per month (ERA5)
2022
2026
Apr
31 mm
22 mm
May
52 mm
47 mm
Jun
58 mm
49 mm
Farmland east of Znojmo: 2026 against 2022
Generated: 19 Oct 2026
1. Vegetation in June 2022 and 2026
Vegetation (NDVI), 28 Jun 2026 — no vegetation · moderate · very dense
Fields east of Znojmo: 2026 against 2022
Mean NDVI, 19 June 2022: 0.71
Mean NDVI, 28 June 2026: 0.52
Rainfall April–June 2022 (ERA5): 141 mm
2. Rainfall and drought index
3. Topsoil
Conclusion
Vegetation in late June 2026 is lower than in June 2022, and spring rainfall was lower too. The two images are nine days apart in the ripening season, so an early-June 2026 image would make the comparison fairer.
Illustration. The images are real Copernicus Sentinel scenes of each place. The numbers, charts and answers are examples, not measured results.
Contains modified Copernicus Sentinel data 2022–2026
Behind the scenesThe app doesn't show this. While it runs, you see “Looking at the data…”.
The assistant's plan MAIN AGENT PROMPT
Goal
Compare crop vegetation in June 2026 and June 2022 east of Znojmo, with spring rainfall and drought.
Area
Arable land east of Znojmo, South Moravia
Time range
June 2022 and June 2026 for images; April–June of both years for rainfall
Vegetation layers for both years and a true-colour layer; one card with a chart
Tools the assistant calls: done
Find Znojmo on the mapmap_geocode
Find cloud-free images for June 2022 and June 2026sentinel_catalog
Add vegetation and true-colour layersmap_add_satellite_layer ×3
Compare vegetation in 2026 with 2022geo_insights
Get rainfall for April to June of both yearscds_era5_timeseries
Get the latest drought indexgdo_drought
Get topsoil propertiessoilgrids
Put the numbers on a cardmap_add_card
Zoom the map to the fieldsmap_fly_to
Report: Farmland east of Znojmo: 2026 against 2022
Vegetation in June 2022 and 2026
Rainfall and drought index
Topsoil
Vegetation in late June 2026 is lower than in June 2022, and spring rainfall was lower too. The two images are nine days apart in the ripening season, so an early-June 2026 image would make the comparison fairer.
Each topic becomes a live map layer with its own legend, the same ones you see in the app.
Vegetation
NDVI from Sentinel-2
Crop condition through the season, harvest timing, and forest stands losing vigour, at stand level rather than single trees.
no vegetationvery dense
Water
NDWI from Sentinel-2
How much of a reservoir is under water, waterlogged fields, wetlands and how far a flood has spread.
dry landdeep water
Built-up areas
NDBI from Sentinel-2
New housing, warehouses and roads appearing on the edge of towns, compared year by year.
open landdense building
Burned areas and fires
NBR from Sentinel-2, NASA FIRMS
Fire scars after a blaze, plus counts of active-fire detections per area from the last 24 hours.
unburnedseverely burned
Radar
Sentinel-1
Radar sees through cloud and at night. Use it to map floods under overcast skies when optical images are blank.
Works in any weather
Surface temperature
Sentinel-3
Urban heat islands at district scale (about 1 km), and land that dries out first in a heatwave.
< −10 °C> 40 °C
Air quality
NO₂, CO and O₃ from Sentinel-5P, OpenAQ stations
Pollution over industrial regions and cities, compared across seasons and against ground stations.
lowvery high
Weather and climate
ERA5 reanalysis, seasonal forecasts, Open-Meteo
Regional rainfall, temperature and drought for the same dates as your images (ERA5, about 25–30 km), so you can tell whether a change is weather or something else.
Shown as charts next to the map
Who it's for: questions by sector
Eight kinds of teams and questions they can ask today. Each answer arrives as map layers, a card with the numbers and, if you want, a PDF report. The links open the full scenario or a step-by-step example.
The questions are examples, not customer stories. The assistant answers when you ask; it does not watch areas in the background.
Farms, agri-lenders and land funds
Check fields from your desk before you drive out, defer a loan or buy land.
You ask
Which fields east of Znojmo are weaker this June than in June 2022, and was this spring drier?
You get
Vegetation layers for both years, a card with spring rainfall and the current drought index, and topsoil data.See this example step by step
You ask
Did crops around Dunajská Streda do worse this July than last July, and was it drier than usual?
You get
A vegetation layer and a card with the change against last July, the rainfall deficit against the 1991–2020 normal and the current drought index.See the use case
You ask
How did vegetation on the farmland east of Znojmo compare in the 2022, 2024 and 2026 seasons, and how dry were those years?
You get
Vegetation layers per season, a card with rainfall against the 1991–2020 normal, topsoil data and a PDF for the investment committee.See the use case
Insurers and loss adjusters
Decide which claims to inspect first after hail, flood or storm, before anyone travels.
You ask
Where did vegetation drop after the hailstorm on 18 June around Břeclav and Valtice?
You get
Vegetation layers from just before and after the storm, a card with the share of the area that dropped sharply, and rainfall for the storm days.See the use case
You ask
Where did the Opava flood around Krnov in mid-September 2024, how much rain fell and how many people live there?
You get
Radar layers that see through cloud, true-colour and water layers, a rainfall chart, residents in the area and a PDF for the claims file.See the use caseSee this example step by step
You ask
How many days above 30 °C and above 30 mm of rain has the Nitra industrial zone had since 2000, and what do projections say for 2050?
You get
A card with hot and heavy-rain days per year and the projected change under two emission scenarios. ERA5 figures are regional (a grid of about 25–30 km), not readings at the site.See the use case
Forest enterprises and wood buyers
Map storm and fire damage, and document forest cover for an EUDR due-diligence file.
You ask
Where did last week's storm knock down forest in the Vysoké Tatry between Štrbské Pleso and Tatranská Lomnica?
You get
NBR damage layers before and after the storm, radar change if it is cloudy, and a card with the share of the area where vegetation dropped sharply.See the use case
You ask
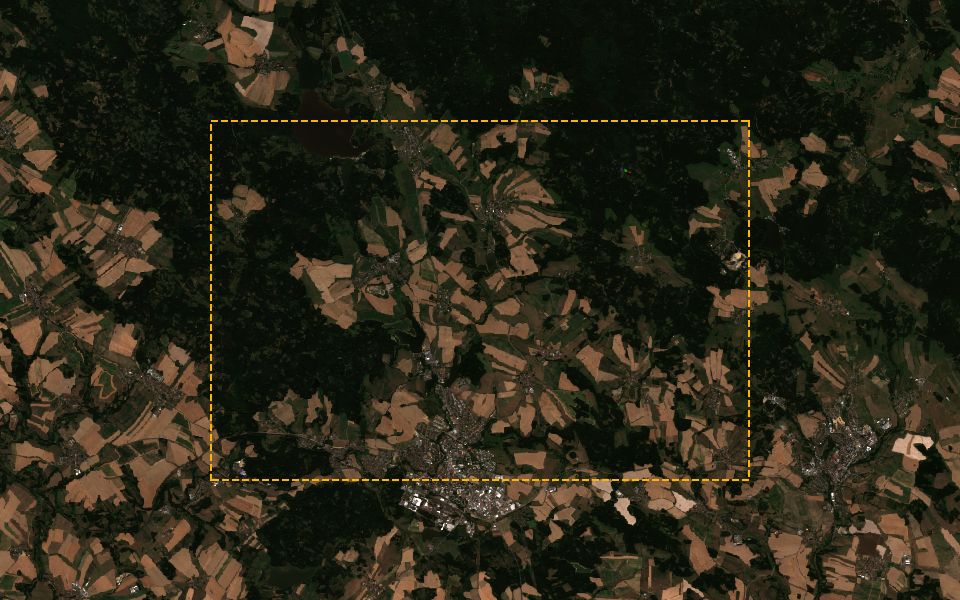
For the forest area I've drawn near Žďár nad Sázavou, where was forest cover lost between summer 2020 and this summer?
You get
Layers for 2020 and today, a card with the share of strong vegetation loss and a PDF that supports your due-diligence file. It is not a compliance decision.See the use case
You ask
Show the 2022 burn scar near Hřensko and how the forest looks there now.
You get
Burn-index layers before and after the fire, a vegetation layer showing the regrowth, and a card with summer temperature against 1991–2020.See the use caseSee this example step by step
Cities, districts and planning institutes
Sourced maps and numbers on heat islands, greenery and rainfall for adaptation plans, council papers and grant reports.
You ask
Around Stromovka and Letná, where is greenery weakest this August, and where does the surface get hottest?
You get
Vegetation, water and true-colour layers, a coarse 1 km surface-temperature layer, and a card with summer rainfall against the 1991–2020 normal.See the use caseSee this example step by step
You ask
Was summer 2026 in Brno hotter than any summer since 1991, and how many tropical days did it have?
You get
A chart of summer temperatures by year, the count of tropical days and a 1 km surface-temperature map of the city, ready for a PDF.See the use case
You ask
How do the new wetland and retention ponds near Hodonín look today, compared with 2021 before construction?
You get
True-colour layers for 2021 and today, a water layer, a change card and a PDF for the project file.See the use case
Water managers and civil protection
Evidence on drought, ponds, floods and fires for reports and briefings, whenever you ask.
You ask
How does rainfall on Záhorie since March compare with the 1991–2020 normal, and where is it driest?
You get
A rainfall anomaly map of the region, and a card with a monthly chart and the current drought index.See the use case
You ask
Are the fishponds around Třeboň holding less water this September than last September?
You get
A water layer for this September and a card with the change in water surface against last year, from radar when it is cloudy.See the use case
You ask
Have satellites detected fires around Bohemian Switzerland in the last 24 hours, and how dry and windy is it there today?
You get
Fire detections from the last 24 hours, counted per grid cell, a card with today's humidity and wind, the current drought index and this summer's hot days.See the use case
Universities and research institutes
Check a hypothesis or plan fieldwork before you write any download or processing code.
You ask
Where on the Lipno reservoir did the water turn green between 10 and 18 December 2025, and where should we sample first?
You get
True-colour images for both dates and a vegetation-index layer that picks up surface scum. It shows where the colour changed, not chlorophyll or toxins.See the use case
You ask
Show Spiš Castle and the fields around it this summer against summer 2020, and where vegetation looks unusual.
You get
True-colour images for both years, a vegetation layer, a radar view and the elevation of the hill. At 10 m you see the complex, not individual walls.See the use case
You ask
How have water and vegetation on the reclaimed mine areas around Sokolov changed since 2019?
You get
True-colour layers for 2019 and this year, and a card with the change in vegetation and water across the area.See the use case
Energy, infrastructure and ESG teams
Screen sites and collect sourced climate figures before you pay for detailed studies.
You ask
Compare terrain and current land use for sites near Komárno, Štúrovo and Levice.
You get
A card with elevation per site and true-colour and NDVI imagery of current land use. Good for ranking a long list; solar yield still needs PVGIS or site data.See the use case
You ask
Is the upper Hron heading into a drier than normal autumn, and how did runoff compare over the last three years?
You get
A seasonal rainfall outlook map, an ERA5 runoff chart against the normal and the current drought index.See the use case
You ask
For our plants in Plzeň and Trnava: hot and heavy-rain days since 1991, the projected change by 2050 and local NO₂.
You get
A card per site with trends and projections, an NO₂ satellite layer plus station counts and averages, and one PDF for the physical-risk section of a CSRD report or a customer questionnaire.See the use case
Property and land developers
A first screen of a plot and its surroundings before you commission studies.
You ask
For a plot north of Trnava: how many hot and heavy-rain days since 2000, what do projections say for 2050, and how high does it sit?
You get
A card with hot and heavy-rain days per year, the projected change under two scenarios and the elevation range. Climate figures are regional (ERA5, about 25–30 km): for screening, not design.See the use case
You ask
How has built-up land around Brno changed since 2023, and where is new construction appearing?
You get
Built-up layers for then and now, a change card and the population of the area.See the use case
You ask
How much has our construction site near Litomyšl changed since spring?
You get
Radar layers for spring and now that work in any weather, a change card and a current true-colour layer. It shows change, not percent complete.See the use case
Use cases: farming, forestry, insurance, ESG and more
Each scenario is a question you can ask today. Pick a sector to narrow the list.
The images are real Copernicus Sentinel scenes of each place, taken on the date shown. The situations and questions are examples. Scenes marked “Outside the current analysis area” show real events from the Copernicus archive in places the assistant can't analyse yet.
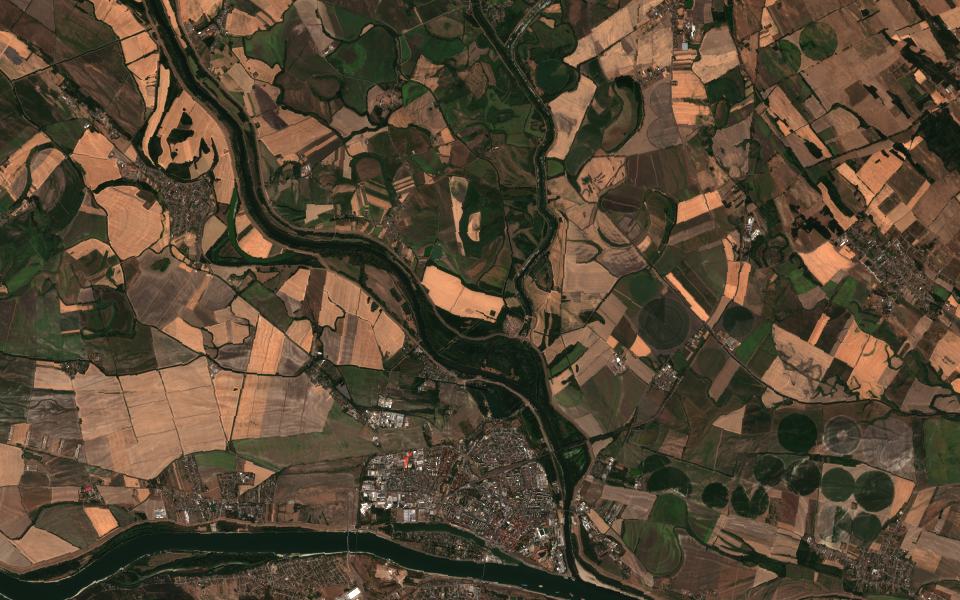
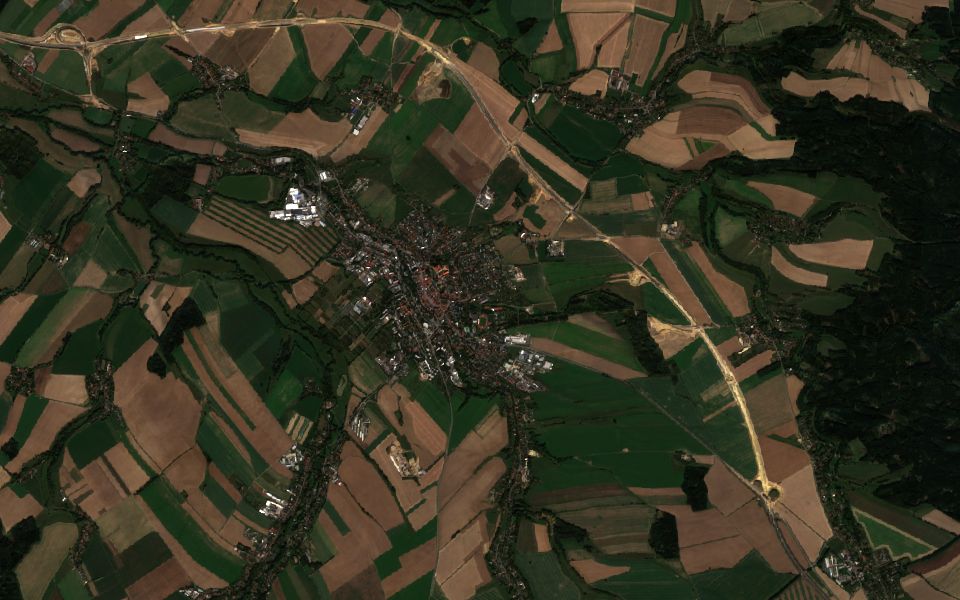
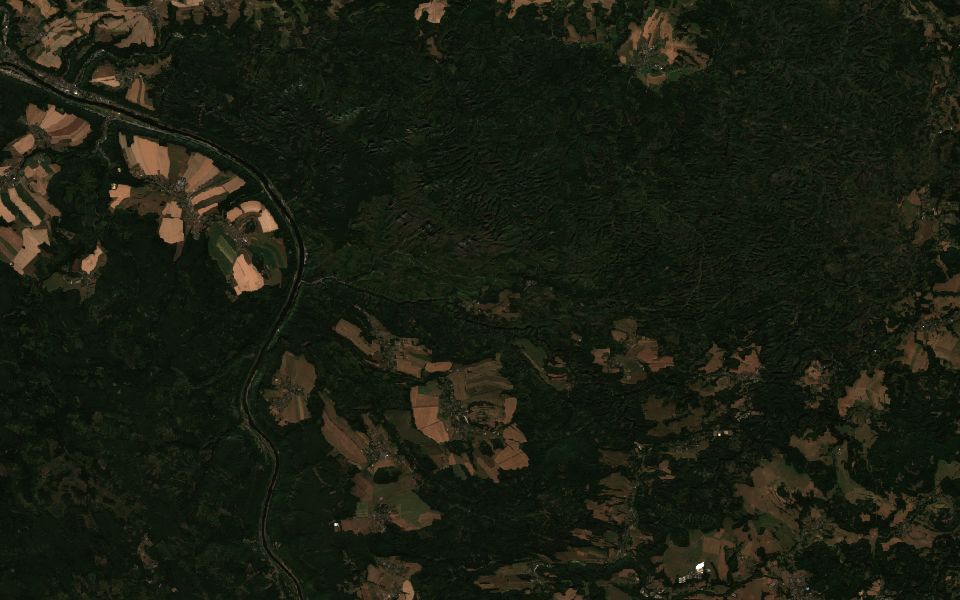
Znojmo.Sentinel-2 L2A, 28 Jun 2026, 1% cloud.Contains modified Copernicus Sentinel data 2022–2026
An agri-investment fund, for example one based in Germany, is evaluating arable land in South Moravia and wants an independent view of how productive the fields have been and how often drought hit, without relying only on the seller's yield figures.
Show how vegetation on the farmland east of Znojmo compared between the 2022, 2024 and 2026 growing seasons, and how dry those years were.
Vegetation layers for each season, a card comparing vegetation and rainfall with the 1991–2020 normal, topsoil data, and a PDF for the investment committee.
Vegetation (NDVI)Rainfall vs normalDrought indexTopsoil
Triage crop claims after a hailstorm
no vegetationvery dense
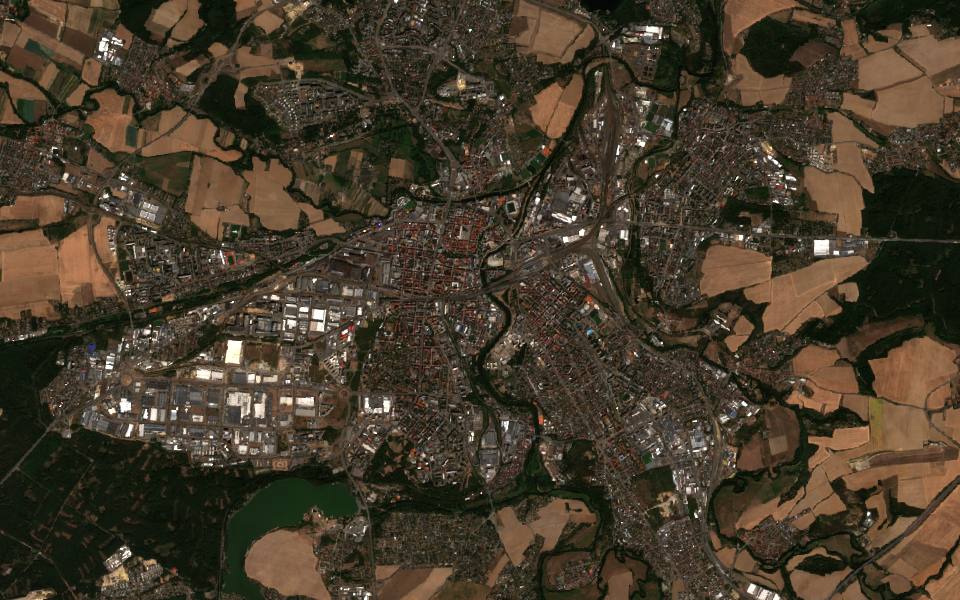
Břeclav.Sentinel-2 L2A, 30 Jun 2026, 0% cloud.Contains modified Copernicus Sentinel data 2026
After a summer hailstorm, a crop insurer receives a batch of claims from vineyards and fields and wants to decide which to inspect first.
Where did vegetation drop after the hailstorm on 18 June around Břeclav and Valtice?
Vegetation layers from just before and just after the storm, a card showing where vegetation dropped sharply, and rainfall for the storm days.
Vegetation before and afterVegetation changeRainfall
Map storm damage in mountain forests
Close to natural colour
Vysoké Tatry.Sentinel-2 L2A, 30 Sep 2026, 0% cloud.Contains modified Copernicus Sentinel data 2025–2026
After a windstorm, a forest enterprise needs a quick overview of where stands were flattened, so it can plan salvage logging before bark beetles move in. Radar still works when it is cloudy.
Where did last week's storm knock down forest in the Vysoké Tatry between Štrbské Pleso and Tatranská Lomnica?
NBR damage layers before and after the storm, a radar change layer if it is cloudy, and a card with the share of the area where vegetation dropped sharply.
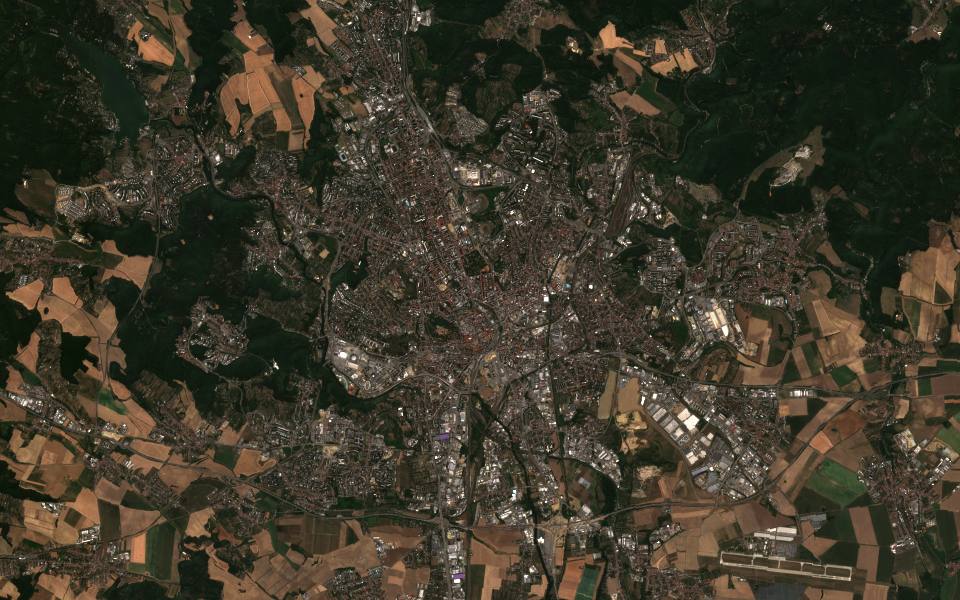
Prague.Sentinel-2 L2A, 14 Aug 2026, 0% cloud.Contains modified Copernicus Sentinel data 2026
A city environment department or a district office (městská část) looks after parks, lawns and street trees. After a dry summer it wants to know where vegetation is stressed, which lawns dried out and where to water or replant, and where surfaces stay dry or hot and rainwater could be held back.
Around Stromovka, Letná and the Vltava bend in Prague, where is vegetation weakest this August, which lawns have dried out, and where could rainwater be retained?
A vegetation layer for August with the weakest areas marked, a water layer showing the river and wet surfaces, a coarse 1 km heat layer for the whole city, and a card with summer rainfall and the elevation of low spots.
Vegetation (NDVI)Water (NDWI)Surface temperature (Sentinel-3)Elevation
Krnov.Sentinel-1 GRD, 15 Sep 2024.Contains modified Copernicus Sentinel data 2024
Storm Boris brought record river levels to northern Moravia in September 2024 and flooded much of Krnov; Copernicus mapped more than 56,000 hectares of flooding across seven countries. A municipality, a regional crisis staff or an insurer wants to see which areas were under water, even under cloud, and how many residents sit in the floodplain.
Show where the Opava floodplain around Krnov was flooded in mid-September 2024 compared with early September, how many people are in it, and how heavy rainfall extremes are changing in the catchment.
A radar layer for 3 and 15 September that sees through cloud, a true-colour image and a water layer after the flood, a card with exposed population, a heavy-rainfall and climate-projection card for the catchment, and a PDF report for the insurer.
The July 2022 fire in Bohemian Switzerland burned more than 1,000 hectares on the Czech side, in stands of bark-beetle-killed spruce, and is one of the most serious forest fires in Czech history. Park rangers, foresters and civil-protection planners want to see the scar, how the forest is regrowing and where dead spruce raises the risk of the next fire.
Show the burn scar near Hřensko between June and September 2022, how vegetation looks there this summer, and how hot and dry the summers around the park have been.
A burn-index layer before and after the fire, a true-colour image of the scar, a vegetation layer for this summer that shows the regrowth, and a card with hot days and the drought index to check the dead-spruce stands before the fire season.
Burned areas (NBR)Vegetation (NDVI)Temperature extremesDrought index
Know where and when to sample a reservoir bloom
Close to natural colour
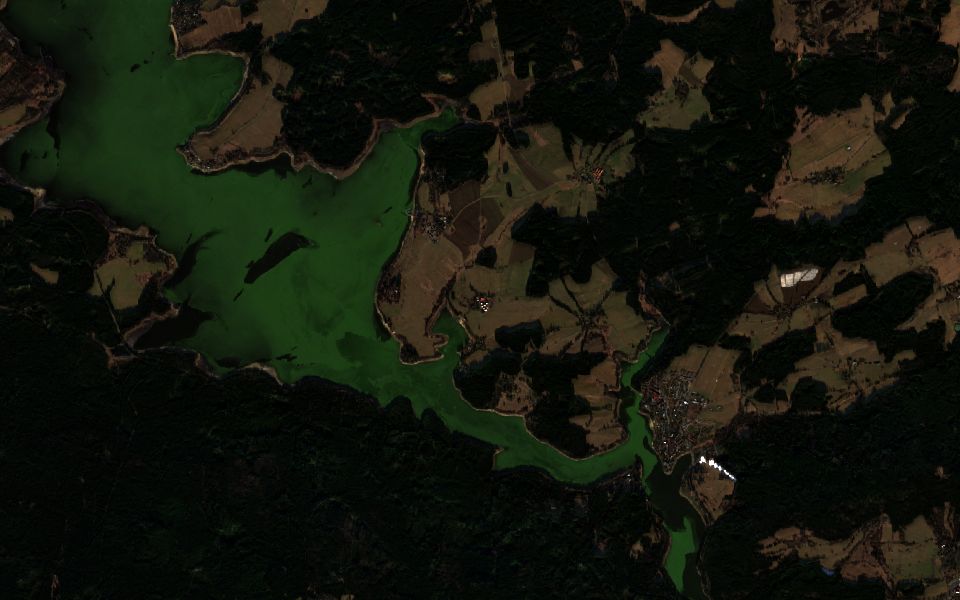
Lipno.Sentinel-2 L2A, 18 Dec 2025, 1% cloud.Contains modified Copernicus Sentinel data 2025
In December 2025 a winter cyanobacterial bloom turned the water of the Lipno reservoir green; the Biology Centre of the Czech Academy of Sciences reported it and confirmed it with Copernicus Sentinel-2 imagery. A water utility or reservoir operator wants to decide where and when to send sampling teams. Satellites complement sampling: they show where the water colour changed, not toxins or species.
Where on the Lipno reservoir did the water turn green between 10 and 18 December 2025, and where should we take samples first?
True-colour images from 10 and 18 December, where the green water appears in the main basin near Frymburk, and a vegetation-index layer that picks up surface scum, so sampling can start where the colour changed. The app has no chlorophyll product, so concentrations still come from the samples.
True colour then and nowVegetation (NDVI)
See what a flash flood left behind
Outside the current analysis area
Close to natural colour
Valencia.Sentinel-2 L2A, 31 Oct 2024, 45% cloud.Archive imagery of a real event. The assistant can't analyse this place yet.Contains modified Copernicus Sentinel data 2024
On 29 October 2024 an extreme rainfall event (DANA) flooded the Valencia region in Spain; Copernicus mapped more than 53,000 hectares as affected. The Sentinel archive shows mud-laden water at the Albufera lagoon and offshore in the days after.
The kind of question: where did the October 2024 flash flood leave water and mud around Valencia compared with a clear day before?
The same approach works for floods in the covered area: true-colour images before and after, a radar layer that sees through cloud, and a PDF report. Here the 31 October image is partly cloudy, which is why radar matters.
True colour then and nowRadar (Sentinel-1)
See the scar of Europe's largest recent wildfire
Outside the current analysis area
Close to natural colour
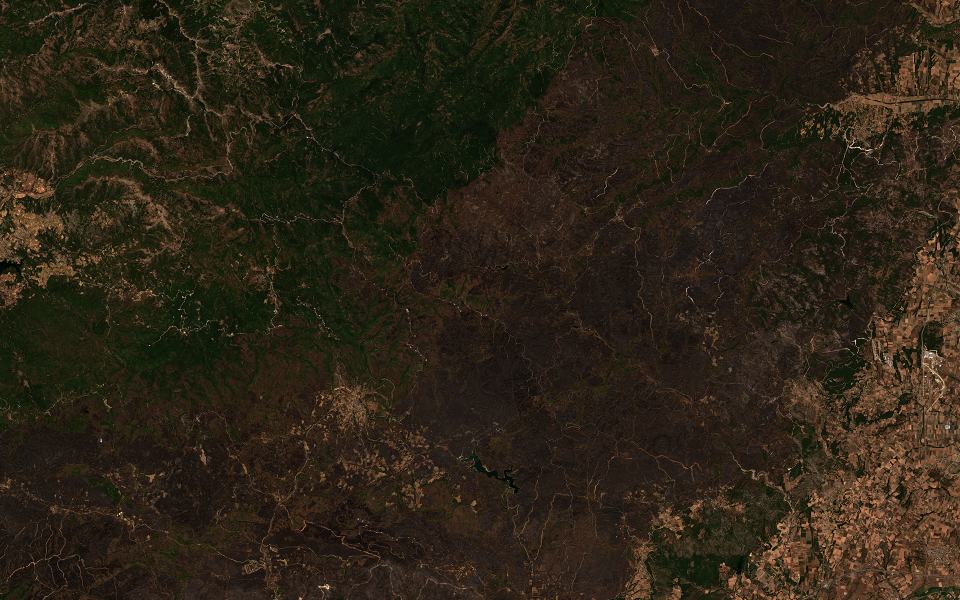
Evros.Sentinel-2 L2A, 12 Sep 2023, 0% cloud.Archive imagery of a real event. The assistant can't analyse this place yet.Contains modified Copernicus Sentinel data 2023
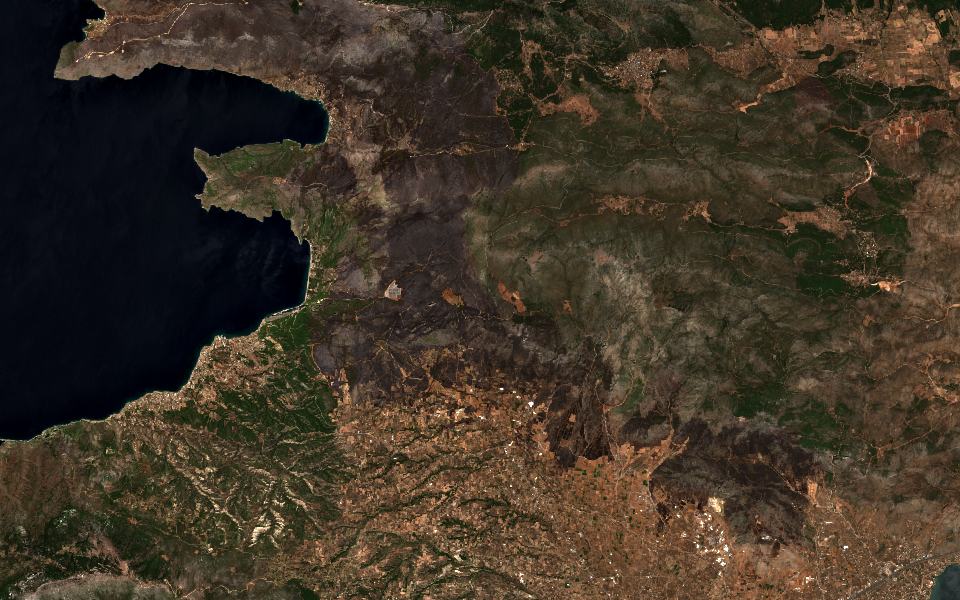
The Evros fire in north-eastern Greece started on 19 August 2023 and burned until early September. Copernicus mapped about 81,000 hectares by 29 August, including Dadia forest, the largest forest fire in Europe in many years.
The kind of question: where did the Evros fire burn between early August and mid-September 2023?
The same approach maps fires in the covered area: true-colour images before and after, a burned-area (NBR) layer and a card with the burned area for the report. Before the season, a vegetation and dryness check can flag the riskiest stands.
True colour then and nowBurned areas (NBR)
Watch an eruption's lava cover a coast
Outside the current analysis area
Close to natural colour
La Palma.Sentinel-2 L2A, 13 Jan 2022, 8% cloud.Archive imagery of a real event. The assistant can't analyse this place yet.Contains modified Copernicus Sentinel data 2021–2022
The Cumbre Vieja eruption on La Palma lasted from 19 September to 13 December 2021. Copernicus mapped lava over more than 1,200 hectares, and more than a thousand buildings were destroyed or damaged.
The kind of question: where did the lava flows reach between August 2021 and January 2022?
True-colour images before and after show the lava field, and a radar layer adds a view that works through cloud and smoke. The same approach applies to landslides and other ground changes in the covered area.
True colour then and nowRadar (Sentinel-1)
See a fire scar next to the suburbs
Outside the current analysis area
Close to natural colour
West Attica.Sentinel-2 L2A, 12 Aug 2026, 0% cloud.Archive imagery of a real event. The assistant can't analyse this place yet.Contains modified Copernicus Sentinel data 2026
A wildfire that began on 31 July 2026 near Psatha and Porto Germeno in West Attica burned more than 10,000 hectares and destroyed or damaged more than 100 homes, according to Copernicus and the Hellenic Fire Service. Copernicus activated rapid mapping as EMSR909.
The kind of question: which areas around Porto Germeno burned between 28 July and 12 August 2026?
The same approach serves wildland-urban fires in the covered area: true-colour images before and after and a burned-area (NBR) layer.
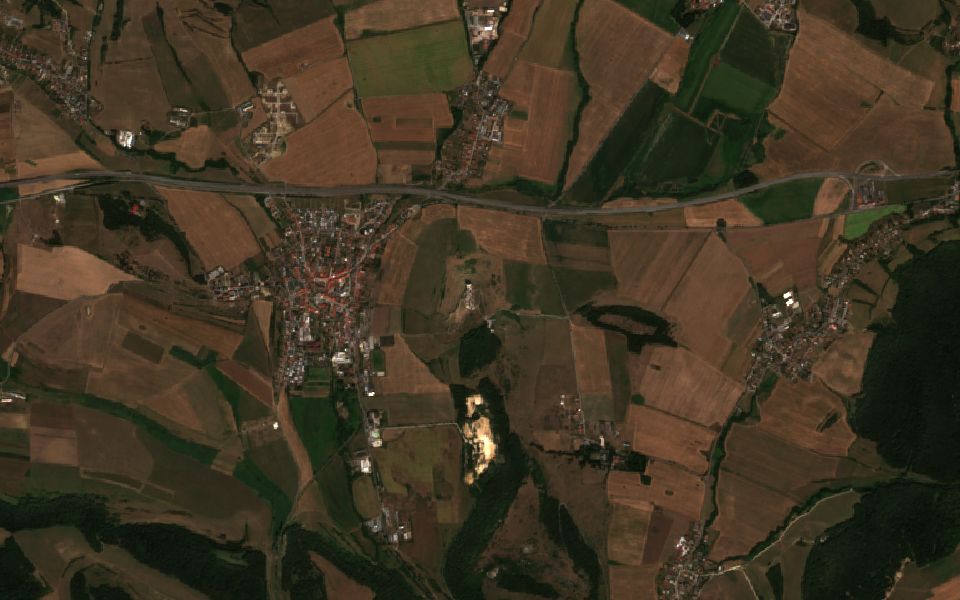
An agricultural lender is asked to defer loan payments because a farm in southern Slovakia lost its crop to drought. The loan officer wants to see whether vegetation really fell behind and whether rainfall was below normal.
Did crops around Dunajská Streda on Žitný ostrov do worse this July than last July, and was it drier than usual?
A vegetation layer for this July and a card with the change against last July, the rainfall deficit and the drought index.
Vegetation (NDVI)Change vs last yearRainfallDrought index
Document forest cover since 2020 for EUDR
Close to natural colour
Žďár nad Sázavou.Sentinel-2 L2A, 14 Aug 2026, 0% cloud.Contains modified Copernicus Sentinel data 2020–2026
From 30 December 2026, a large or medium-sized furniture maker buying roundwood from Czech suppliers has to document under the EU Deforestation Regulation that the source forests were not cleared after 31 December 2020. The buyer draws the supply area on the map.
For the forest area I've drawn near Žďár nad Sázavou, compare summer 2020 with this summer and show where forest cover was lost.
True-colour layers for 2020 and today, a card with the share of the area showing a strong vegetation drop (measured over the rectangle around your drawing), and a PDF that supports the due-diligence file. It is not a compliance determination.
True colour 2020 vs todayVegetation changeForest damage (NBR)
See how dry your region is this year
no vegetationvery dense
Záhorie.Sentinel-2 L2A, 9 Aug 2026, 0% cloud.Contains modified Copernicus Sentinel data 2026
A water company on sandy, drought-prone soils needs evidence for limiting irrigation withdrawals and for its annual report.
How does rainfall on Záhorie between Malacky and Senica since March compare with the 1991–2020 normal, and where is it driest?
A rainfall map of the region, a card comparing this season with the normal, the drought index and a monthly chart.
Rainfall mapRainfall vs normalDrought index
Screen a plant site for heat and heavy rain
Close to natural colour
Nitra.Sentinel-2 L2A, 14 Aug 2026, 0% cloud.Contains modified Copernicus Sentinel data 2026
An industrial property insurer, for example one based in Germany, is underwriting a factory in Slovakia and wants a documented view of local heat and heavy-rain exposure, today and under future climate scenarios.
How many days above 30 °C and how many days with more than 30 mm of rain has the industrial zone in Nitra had since 2000, and what do projections say for 2050?
A card with hot days and heavy-rain days over time, the projected change under two emission scenarios, and the site's elevation.
Temperature extremesHeavy rainfallClimate projectionsElevation
Plan small hydro output for the coming months
Close to natural colour
Brezno.Sentinel-2 L2A, 14 Aug 2026, 0% cloud.Contains modified Copernicus Sentinel data 2026
An operator of small hydro plants plans maintenance and sales around whether rainfall will be normal in the next few months.
Is the upper Hron around Brezno heading into a drier than normal autumn, and how did runoff compare in the last three years?
A seasonal rainfall outlook map, the drought index, and an ERA5 chart of runoff in recent years against the normal.
Seasonal outlookRunoff (ERA5)Drought index
Track progress on a road build
Close to natural colour
Litomyšl.Sentinel-2 L2A, 6 Oct 2026, 1% cloud.Contains modified Copernicus Sentinel data 2026
A bank financing a road contractor and the road authority both want an independent monthly view of where earthworks and paving have advanced. Radar sees ground changes in any weather.
How much has our road construction site near Litomyšl changed since spring?
Radar layers for spring and now, a built-up change card along the route, and a true-colour layer of the current state.
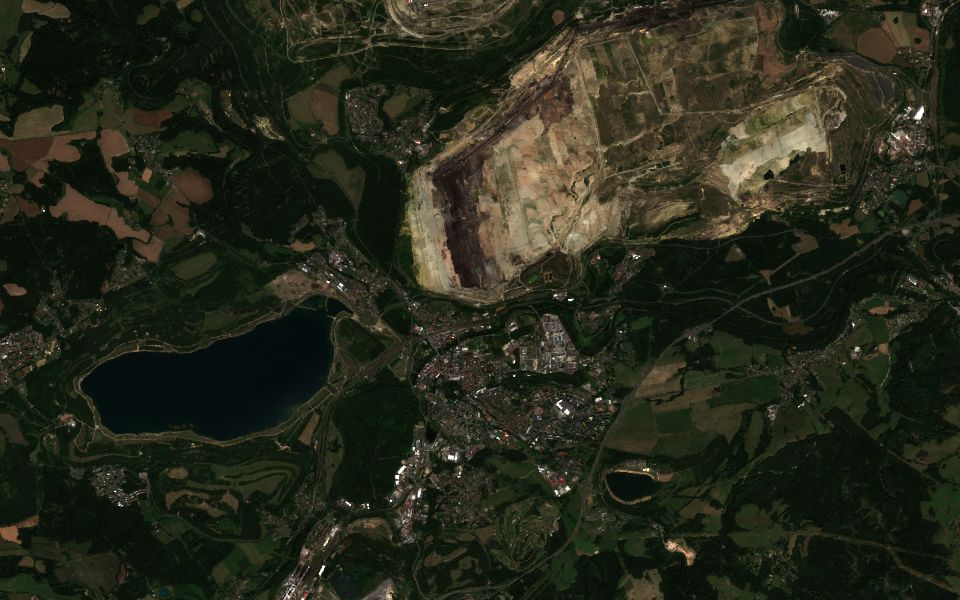
A mining company and the regional authority report on how fast a former open-pit lignite mine is turning into lakes and green land.
How have water and vegetation on the reclaimed mine areas around Sokolov changed since 2019?
True-colour layers for 2019 and this year, plus a card with the change in vegetation and water across the area.
True colour then and nowVegetation (NDVI)Water (NDWI)
Confirm an EU-funded project was built
Close to natural colour
Hodonín.Sentinel-2 L2A, 4 Aug 2026, 0% cloud.Contains modified Copernicus Sentinel data 2021–2026
A grant authority and a municipality need evidence that an EU-funded floodplain restoration with new wetlands and retention ponds exists and holds water, without a site visit.
Show the new wetland and retention ponds along the Morava near Hodonín, before construction in 2021 and today.
True-colour layers for 2021 and today, a water layer, and a change card, ready to export as a PDF for the project file.
True colour 2021 vs todayWater (NDWI)Vegetation (NDVI)
Fire-risk briefing on request for civil protection
Close to natural colour
Bohemian Switzerland.Sentinel-2 L2A, 15 Aug 2026, 0% cloud.Contains modified Copernicus Sentinel data 2026
During a hot, dry spell, the fire service and civil protection office want one view of active fires, today's weather and how dry the season has been, to decide on patrols and fire bans.
Are there any fires around Bohemian Switzerland right now, and how dry and windy is it there today?
Fire detections from the last 24 hours, counted per grid cell on the map, a card with today's humidity and wind, the drought index and this summer's hot days.
Fire detections per cell (24 h)Today's weatherDrought indexHot days
Climate-risk figures for CSRD reporting
Close to natural colour
Plzeň.Sentinel-2 L2A, 15 Aug 2026, 0% cloud.Contains modified Copernicus Sentinel data 2026
A large automotive group in scope of the CSRD, for example one headquartered in Germany, describes the physical climate risks of its Czech and Slovak plants in its sustainability report, and smaller suppliers get the same questions in customer questionnaires. Both need consistent, sourced numbers.
For our plants in Plzeň and Trnava, compare hot days and heavy-rain days since 1991, the projected change by 2050, and the local NO₂ level.
A card per site with heat and heavy-rain trends and projections, an NO₂ satellite layer plus station counts and averages, all in one PDF.
Temperature extremesClimate projectionsNO₂ (Sentinel-5P)Station averages (OpenAQ)
Compare sites for a new warehouse
Close to natural colour
Košice.Sentinel-2 L2A, 5 Aug 2026, 0% cloud.Contains modified Copernicus Sentinel data 2026
A logistics developer choosing between sites for a distribution centre in eastern Slovakia wants to compare winter conditions, terrain and the nearby labour pool.
Compare snow and frost days, terrain and population within 20 km for sites near Košice airport and in Prešov.
A card comparing snow, frost days, elevation and nearby population, plus a built-up layer showing existing industrial areas.
Snow and frostElevationPopulationBuilt-up (NDBI)
Fact-check a hottest-summer claim
Close to natural colour
Brno.Sentinel-2 L2A, 4 Aug 2026, 0% cloud.Contains modified Copernicus Sentinel data 2026
A regional newsroom wants to check whether this was the hottest summer on record in Brno and illustrate the story with a map of the hottest districts.
Was summer 2026 in Brno hotter than any summer since 1991, and which parts of the city were hottest?
A chart of summer temperatures by year, the number of tropical days, and a 1 km surface-temperature map of the city, exportable as a PDF.
Summer temperatureTropical daysSurface temperature (Sentinel-3)
Prepare a field survey of a castle site
Close to natural colour
Spiš Castle.Sentinel-2 L2A, 16 Aug 2026, 0% cloud.Contains modified Copernicus Sentinel data 2020–2026
An archaeology institute or a monument-care office is preparing a field survey of a castle and the hill it stands on. Before going out, the team wants landscape context, vegetation anomalies around the hill that can hint at buried structures, and how the site and its surroundings have changed over the years.
Show Spiš Castle and the land around it this summer, compare it with summer 2020, and show where vegetation in the surrounding fields looks unusual.
True-colour images for 2020 and today, a vegetation layer and a radar view of the surroundings, and a card with the elevation of the hill. At 10 m resolution Sentinel-2 shows the castle complex and its surroundings, not individual walls, so it is a starting point for the field survey.
True colour then and nowVegetation (NDVI)Radar (Sentinel-1)Elevation
Built on open European and global data
Sentinel Assistant connects to the main public Earth-observation archives, so you get one place to ask instead of a dozen portals.
Copernicus satellites
Sentinel-1 radar
Sentinel-2 optical imagery
Sentinel-3 land and sea temperature
Sentinel-5P atmosphere
Copernicus Climate Data Store (ERA5)
Other satellite archives
EUMETSAT Meteosat and Metop
Landsat and MODIS
WorldPop population grids
Elevation models
NASA FIRMS active fires
Ground and activity data
Open-Meteo weather
OpenAQ air-quality stations
OpenStreetMap
SoilGrids soil data
OpenSky air traffic
Your work stays private
You sign in with your Google account. Your conversations, maps and results are visible only to you.
Pick up where you left off
Every conversation is saved with its map layers, so you can reopen an analysis weeks later and see the same view.
Every layer is traceable
Each map layer shows its data source, the period it covers and its cloud-cover limit, so you can cite it in a report.
Questions
Which area does Sentinel Assistant cover?
The data comes from global archives. Copernicus Sentinel satellites image land areas worldwide, Sentinel-2 since 2015 and Sentinel-1 since 2014, and ERA5 climate records reach back to 1940. The assistant's analysis, maps, cards and reports currently work for Czechia, Slovakia and the border regions, roughly 47.7–51.2° N and 11.8–22.6° E. That includes parts of Bavaria, Saxony, northern Austria, southern Poland and northern Hungary. If you ask about a place outside this area, the assistant tells you it can't analyse it yet. We're working on wider coverage.
Does Sentinel Assistant monitor areas or send alerts?
No. It is not a continuous monitoring service: it answers when you ask and does not watch areas in the background. For warnings, follow your national weather service and civil protection authorities. Fire detections from NASA FIRMS usually appear within a few hours of a satellite pass, so you can check an area whenever you need to.
Where does the data come from?
Mainly from the EU Copernicus programme: Sentinel-1 radar, Sentinel-2 optical imagery, Sentinel-3 surface temperature, Sentinel-5P air quality and ERA5 climate records, plus open sources such as NASA FIRMS, Landsat and OpenStreetMap.
How detailed and how recent are the images?
Sentinel-2 images have 10 m pixels, enough to compare individual fields and forest stands. A new pass reaches each area every few days; cloudy scenes can be skipped or replaced by radar.
Do I need GIS or remote-sensing skills?
No. You type a question or draw an area on the map. The assistant chooses the satellite, dates and cloud limit, and every layer shows its data source, period and cloud-cover limit.
How do I get access?
Sentinel Assistant is in early access. You sign in with a Google account that has been invited; your conversations and maps are visible only to you.
Start with an area you already know
Sentinel Assistant is in early access. Open the app, ask about a site you know in Czechia, Slovakia or the border regions, and see what the satellites show.